V3 Architecture: Hardware Build, Migration & Service Monitoring
Retiring pavilion, building an Optiplex 7060 micro as the new primary node, and deploying Uptime Kuma.
Why V3 Exists
V2 closed in a good state: three isolated VLANs, centralized DNS, HTTPS service routing, and a SIEM with validated custom detection rules. The natural next steps were expanded detection coverage, remote access via WireGuard or Tailscale, and more services on inspiron.
That plan changed when I found a Dell Optiplex 7060 micro on sale at a very good price. pavilion, the V2 primary node, was an HP All-in-One from 2014 running a mobile i5, 16 GB of old DDR3L, and delivering okayish performance. The Optiplex offered more capability in a much smaller form factor, and so the decision was made to lead into a V3 rebuild rather than extending V2 any further.
pavilion was decommissioned, its SSD pulled for reuse, and Optiplex would replace it as the new node: optiplex.
Hardware: Optiplex 7060 Micro
The Optiplex 7060 Micro is a small-form-factor business desktop built on Intel’s 8th-generation platform. The unit arrived without storage and with a base CPU configuration.
As Arrived
| Spec | Value |
|---|---|
| Type | Dell OptiPlex 7060 Micro |
| CPU | Intel Core i5-8500T (6c/6t, 3.5 GHz boost) |
| RAM | 16 GB DDR4 (1×16 GB) |
| Storage | None |
Upgrades
Two components were purchased separately; storage was migrated from pavilion:
| Component | Change | Notes |
|---|---|---|
| CPU | i5-8500T → i7-8700T | 6c/12t, 4.0 GHz boost, doubles thread count |
| RAM | 16 GB → 32 GB DDR4 | Second matching 16 GB stick added |
| Storage | — | 1 TB SATA SSD migrated from pavilion |
Doubling the thread count from 6 to 12 helps with better VM concurrency and headroom as the workload grows.
Assembly
The Optiplex uses a release mechanism for its side panel. The CPU socket (LGA 1151), RAM slots, and 2.5” drive bay are all accessible with few cable management complications.
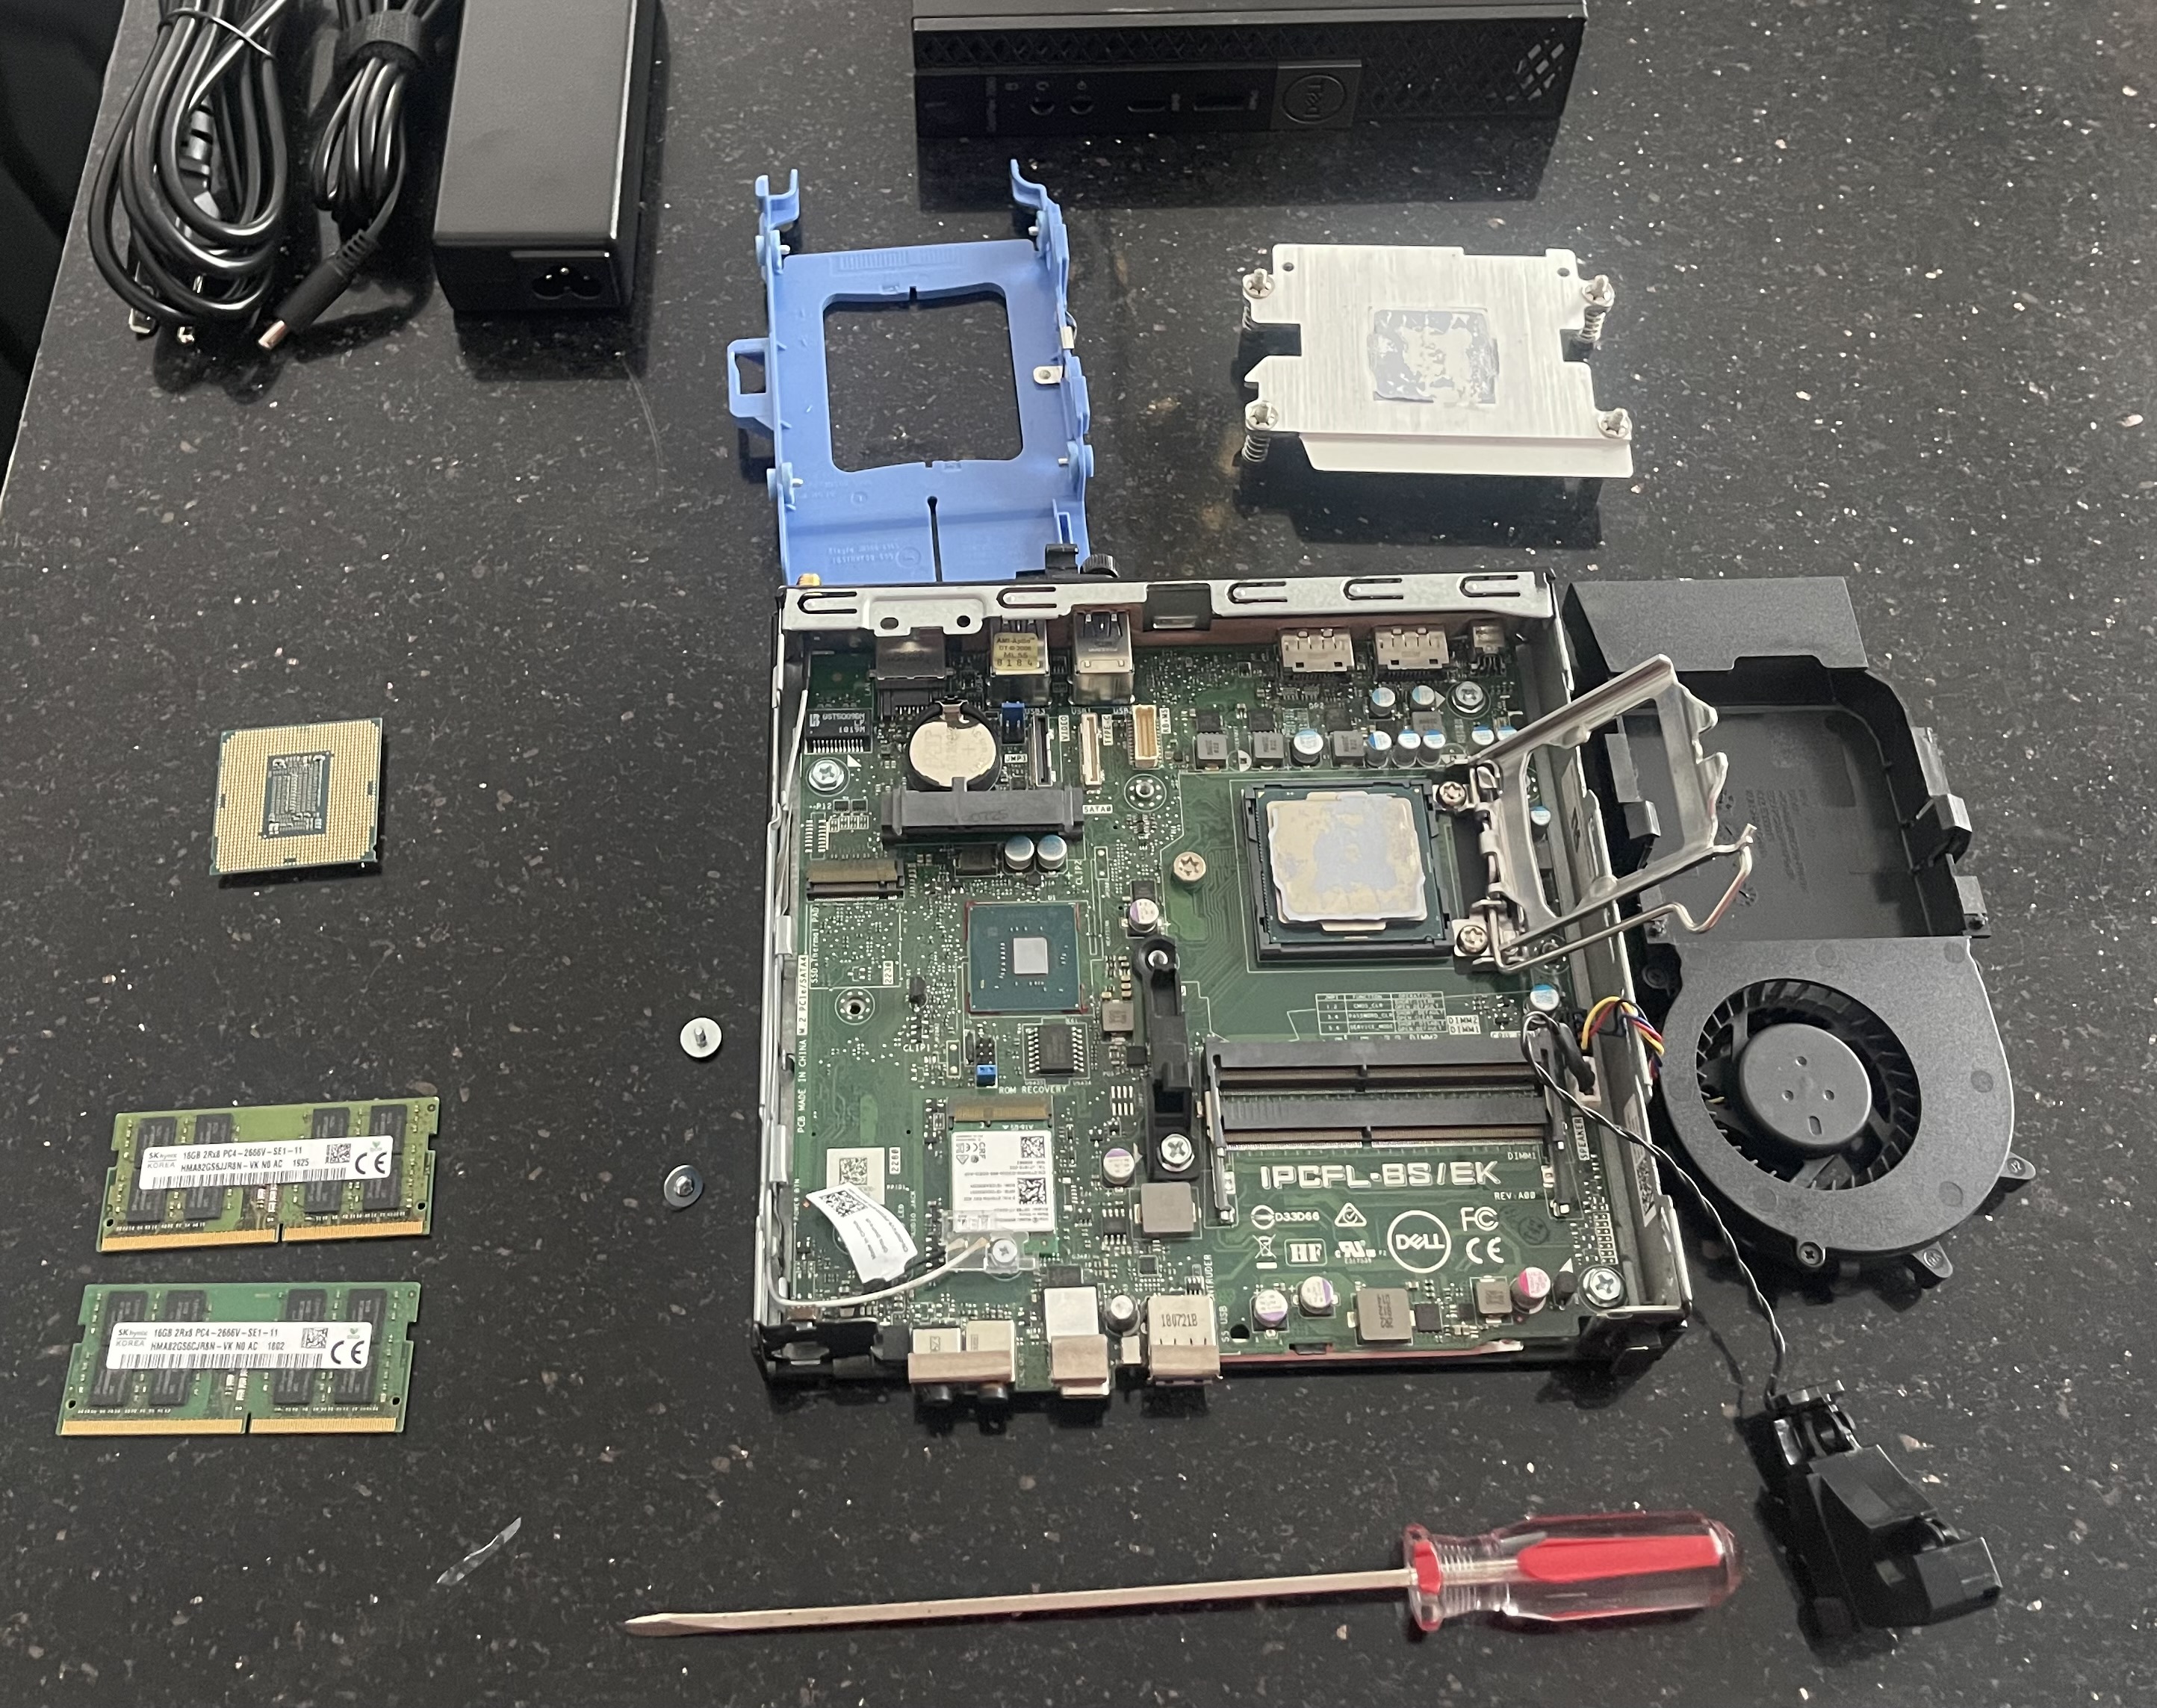 Optiplex 7060 Micro opened for component installation
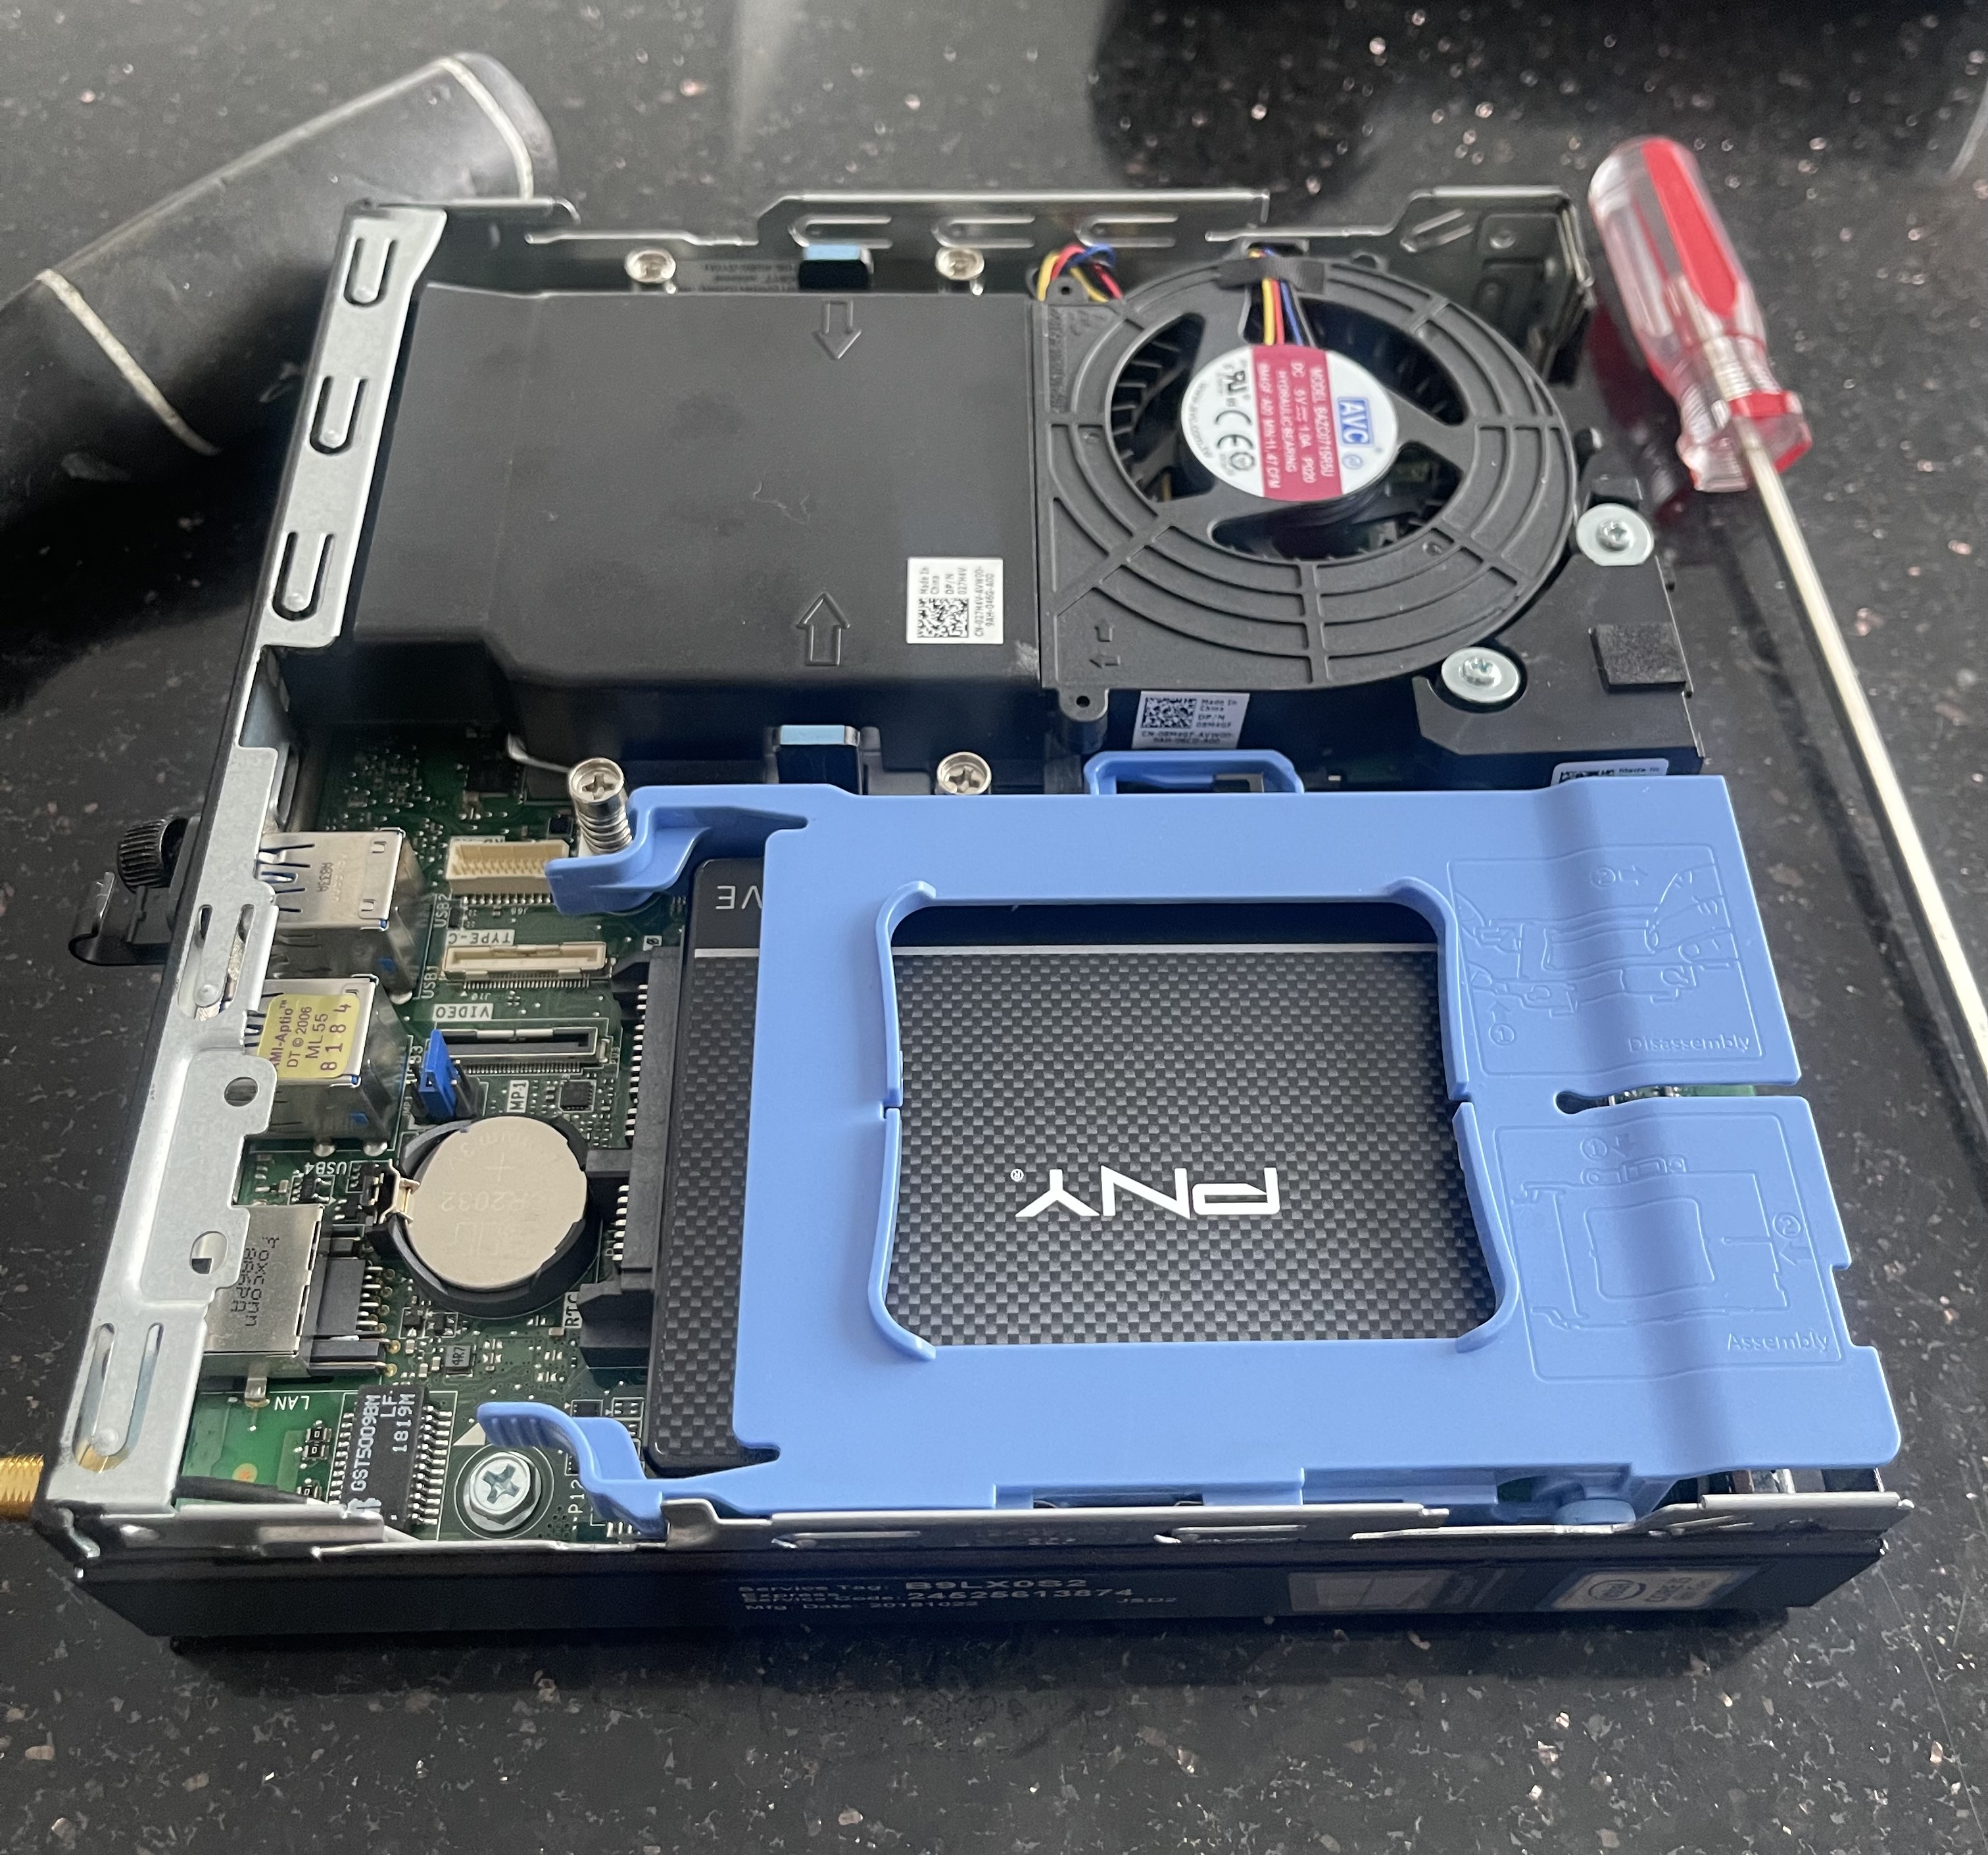 Upgrade completed
Final Specifications
| Spec | Value |
|---|---|
| Type | Dell OptiPlex Micro 7060 |
| CPU | Intel Core i7-8700T (6c/12t, 4.0 GHz boost) |
| RAM | 32 GB DDR4 |
| Storage | 1 TB SATA SSD |
| OS | Proxmox VE |
| VLAN | 20 — Lab |
BIOS Verification
Before any software installation, the system was powered on and BIOS was entered to confirm every component was detected correctly.
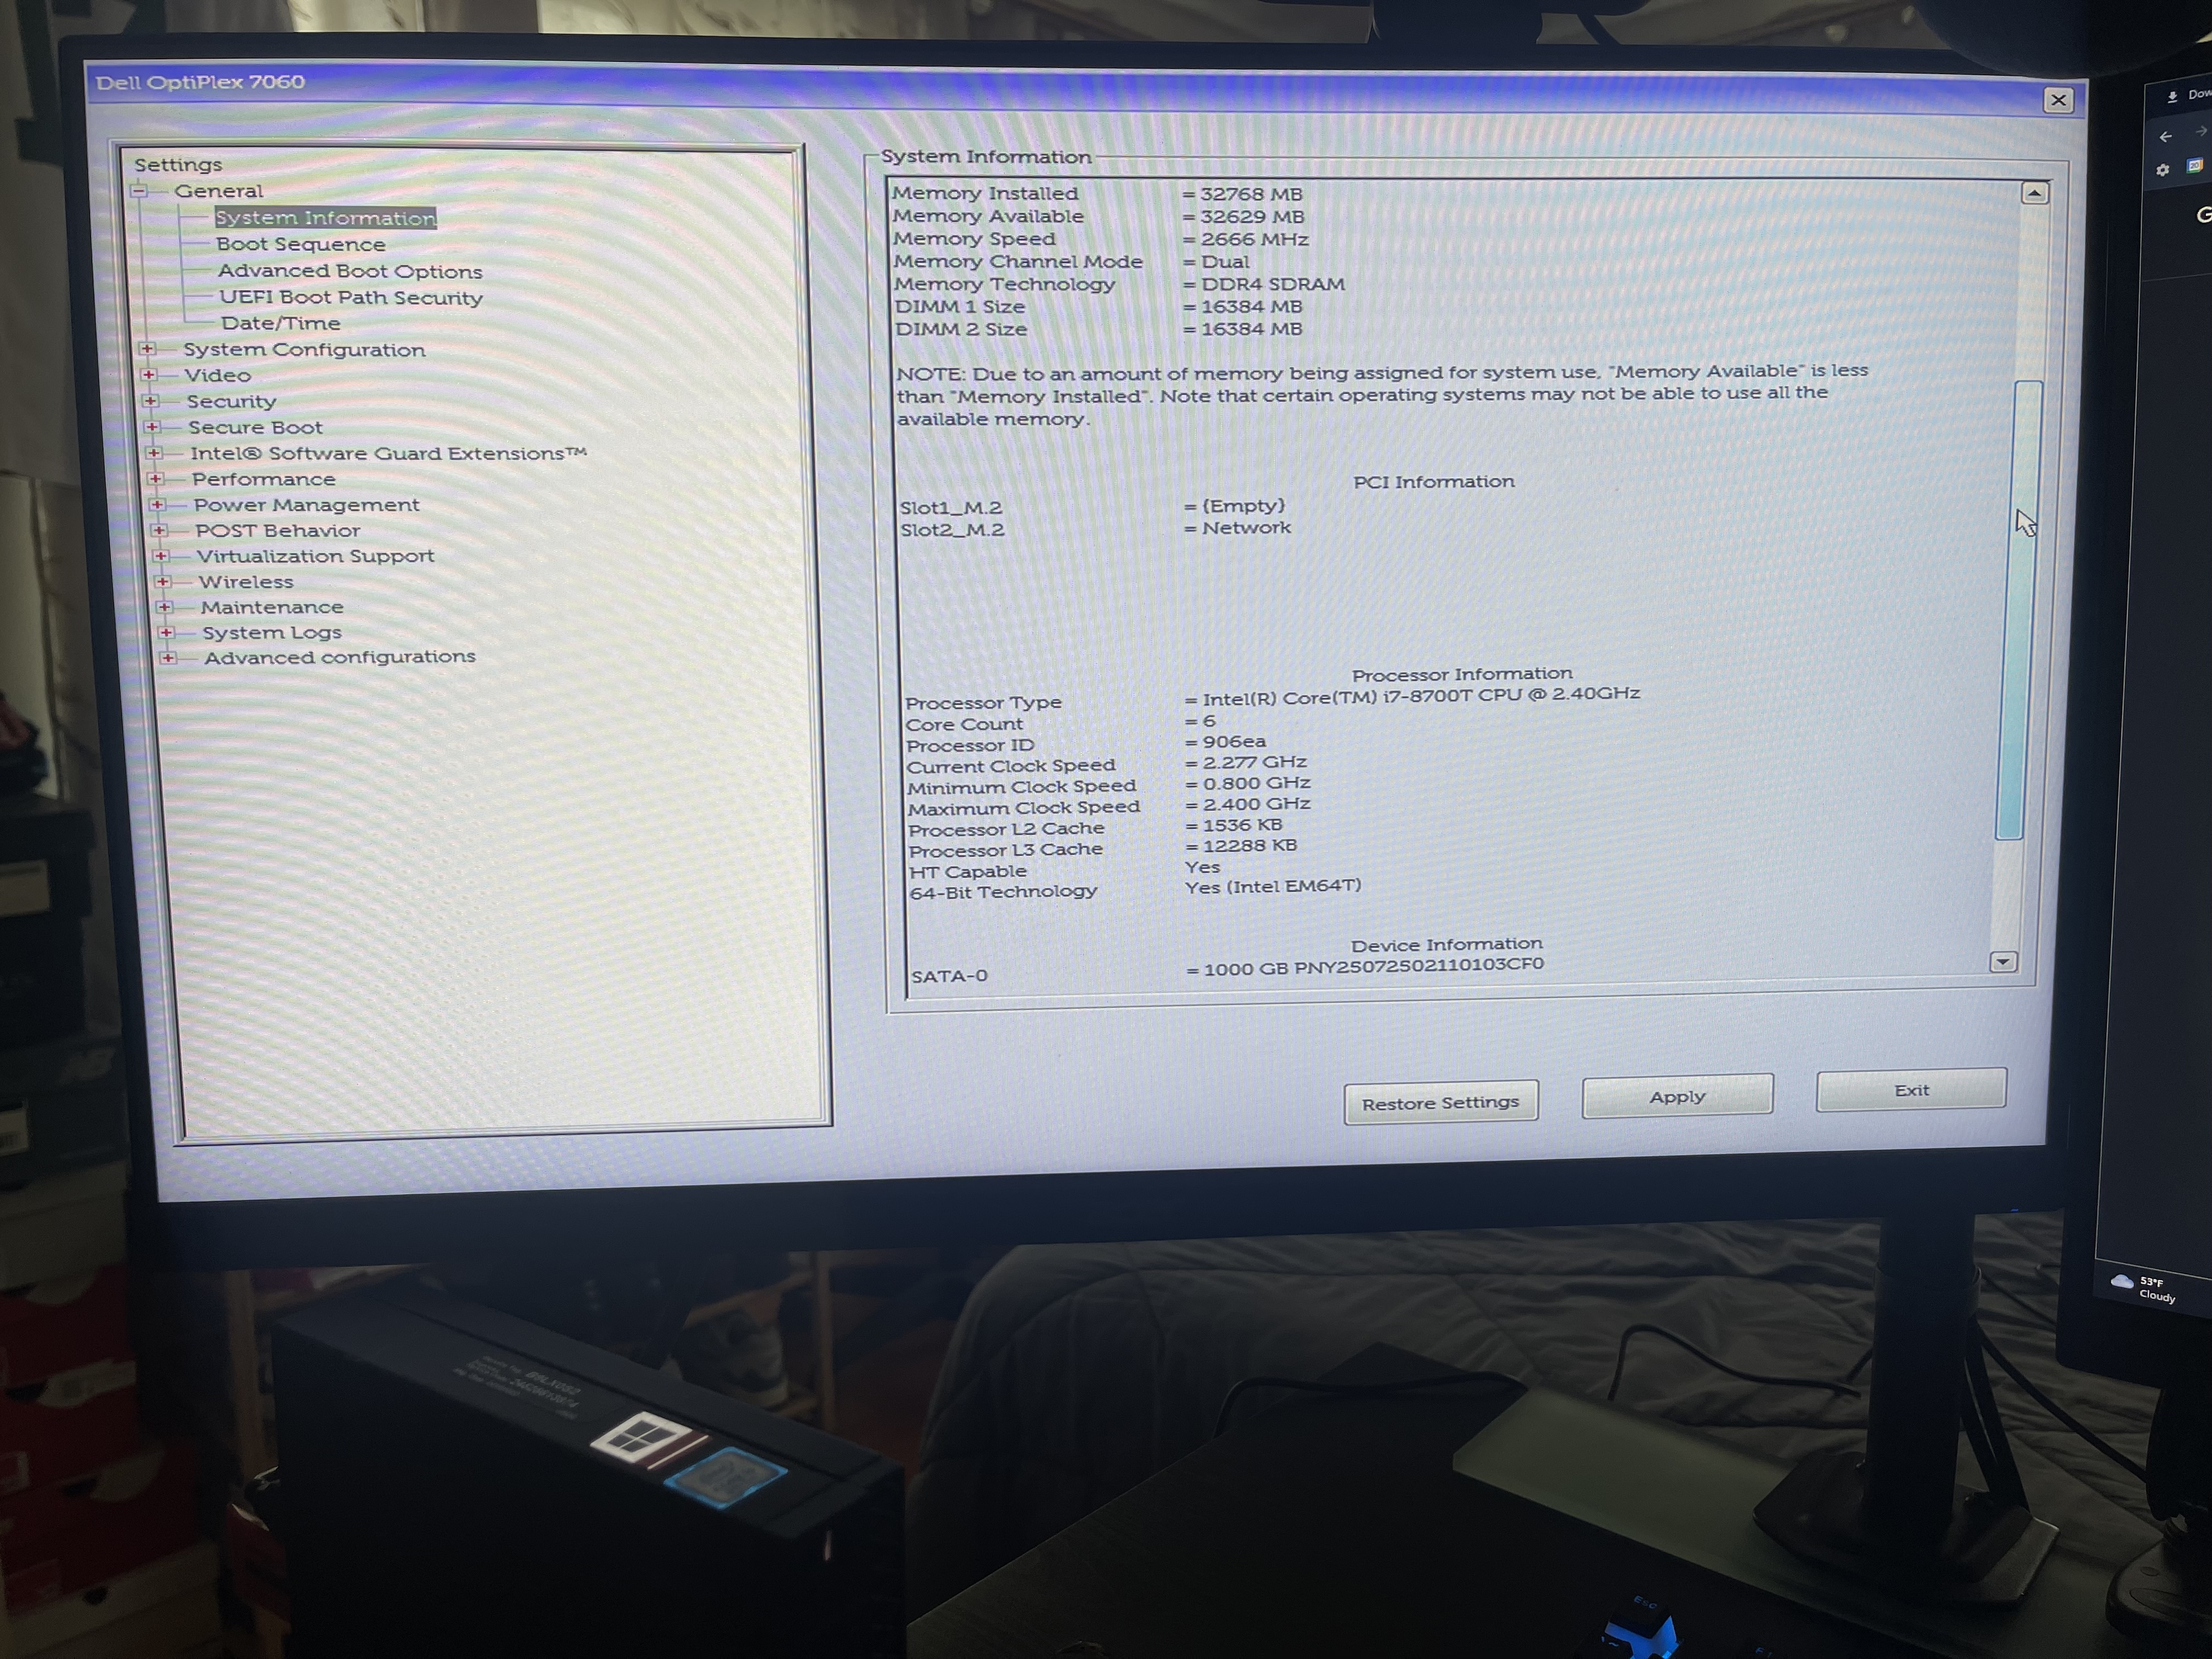 BIOS confirming all components
All three components registered correctly. Time to boot into the Proxmox installation media.
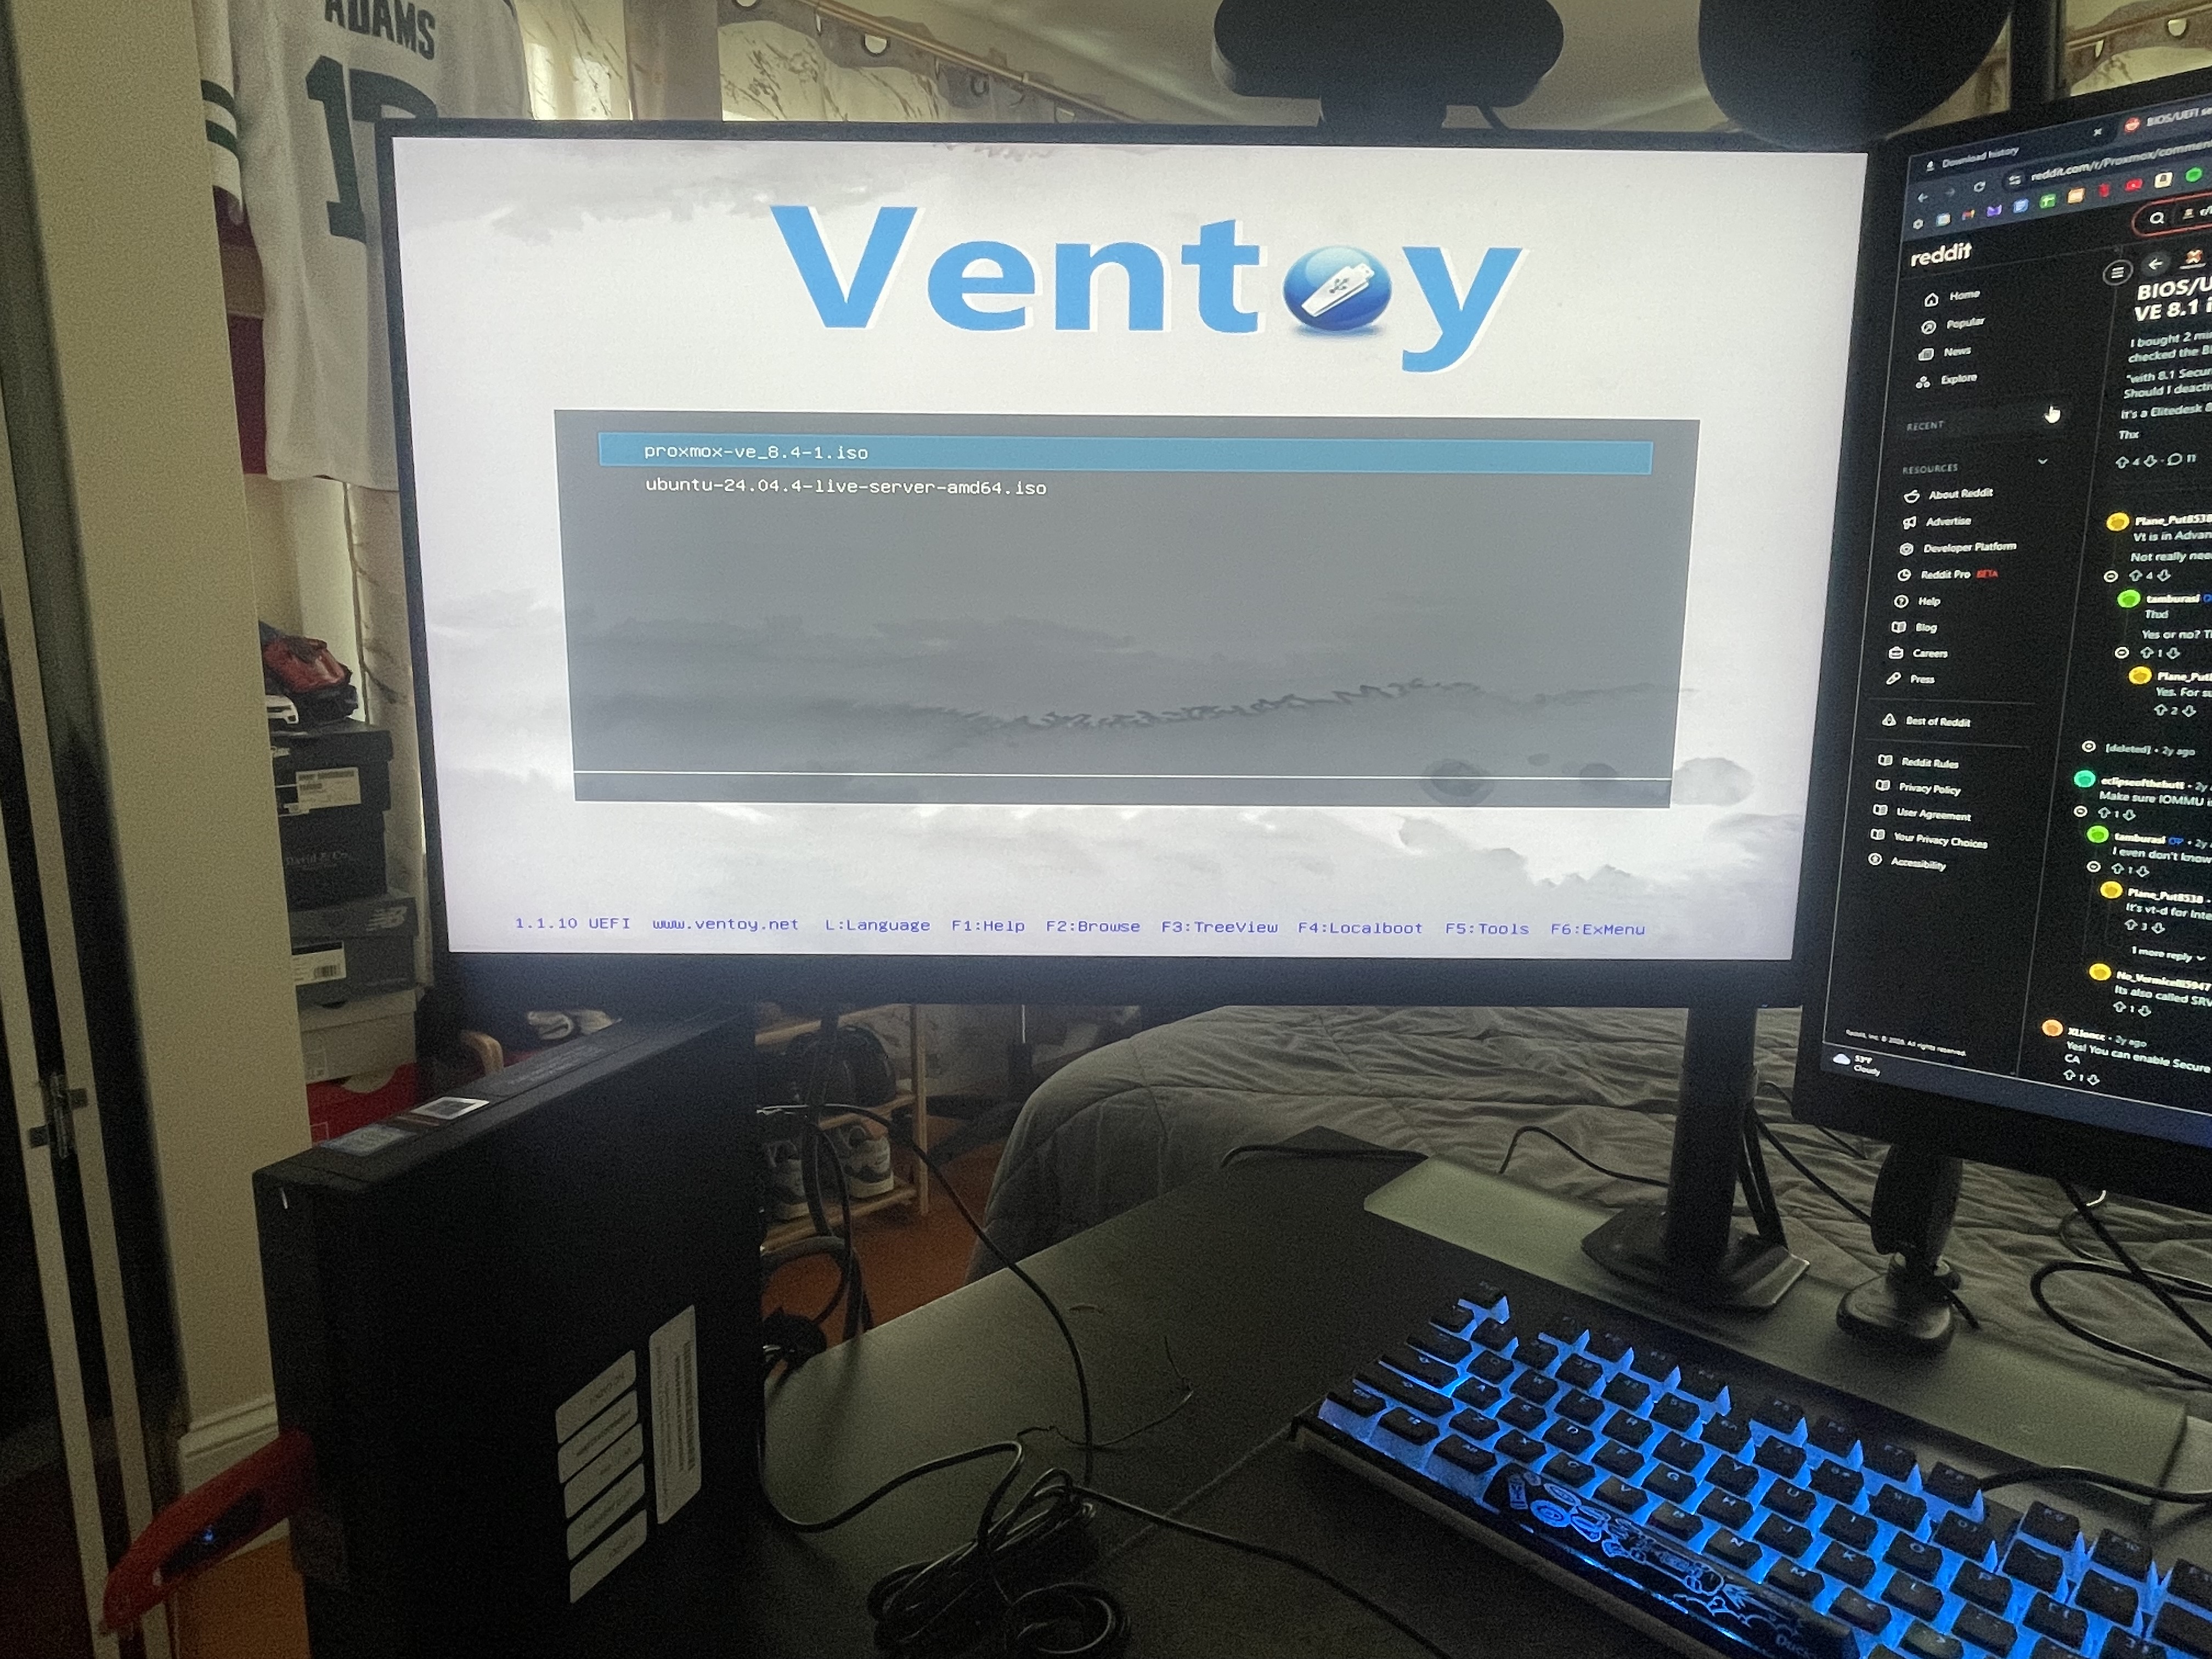 Ventoy boot menu
Proxmox VE
The Proxmox installation followed the same process documented in V1 and V2. The Optiplex is modern enough that UEFI boot and USB detection worked without any of the Legacy Boot troubleshooting the original Pavilion required.
The management IP was assigned statically on VLAN 20, and it would inherit pavilion’s previous address.
Post-install steps were identical to V2: enterprise repository disabled, community repository enabled, subscription nag removed.
Core Services Migration
With Proxmox running, core services were reinstalled using the community helper scripts, the same method as V2.
Pi-hole and Nginx Proxy Manager were deployed first. Both followed the configuration already covered in the V2 infrastructure posts; local DNS records and proxy host entries were recreated identically.
Pi-hole had a brief downtime window during the transition. A non-issue as I already configured OpenWRT with a secondary upstream DNS server as a fallback, so devices continued resolving DNS without interruption.
Wazuh was redeployed as well. Agent enrollment and custom detection rule configuration are documented in full in the V2 Wazuh posts; the V3 deployment introduced no meaningful differences.
Uptime Kuma: Service Monitoring
Uptime Kuma is a new service introduced in V3. It provides continuous uptime monitoring for services, surfacing availability issues with a clean status dashboard.
Wazuh handles security event detection and log analysis. Uptime Kuma answers a different question:
Is the service up and responding?
Deployment
Uptime Kuma was deployed as an LXC container on optiplex using the Proxmox VE community helper scripts.
| Setting | Value |
|---|---|
| CT ID | 301 |
| VLAN | 20 — Lab |
After installation, a local DNS record was added in Pi-hole pointing kuma.jamcre.dev to the NPM IP, and a reverse proxy host was created in NPM for the domain, the same pattern used for every other service in the stack.
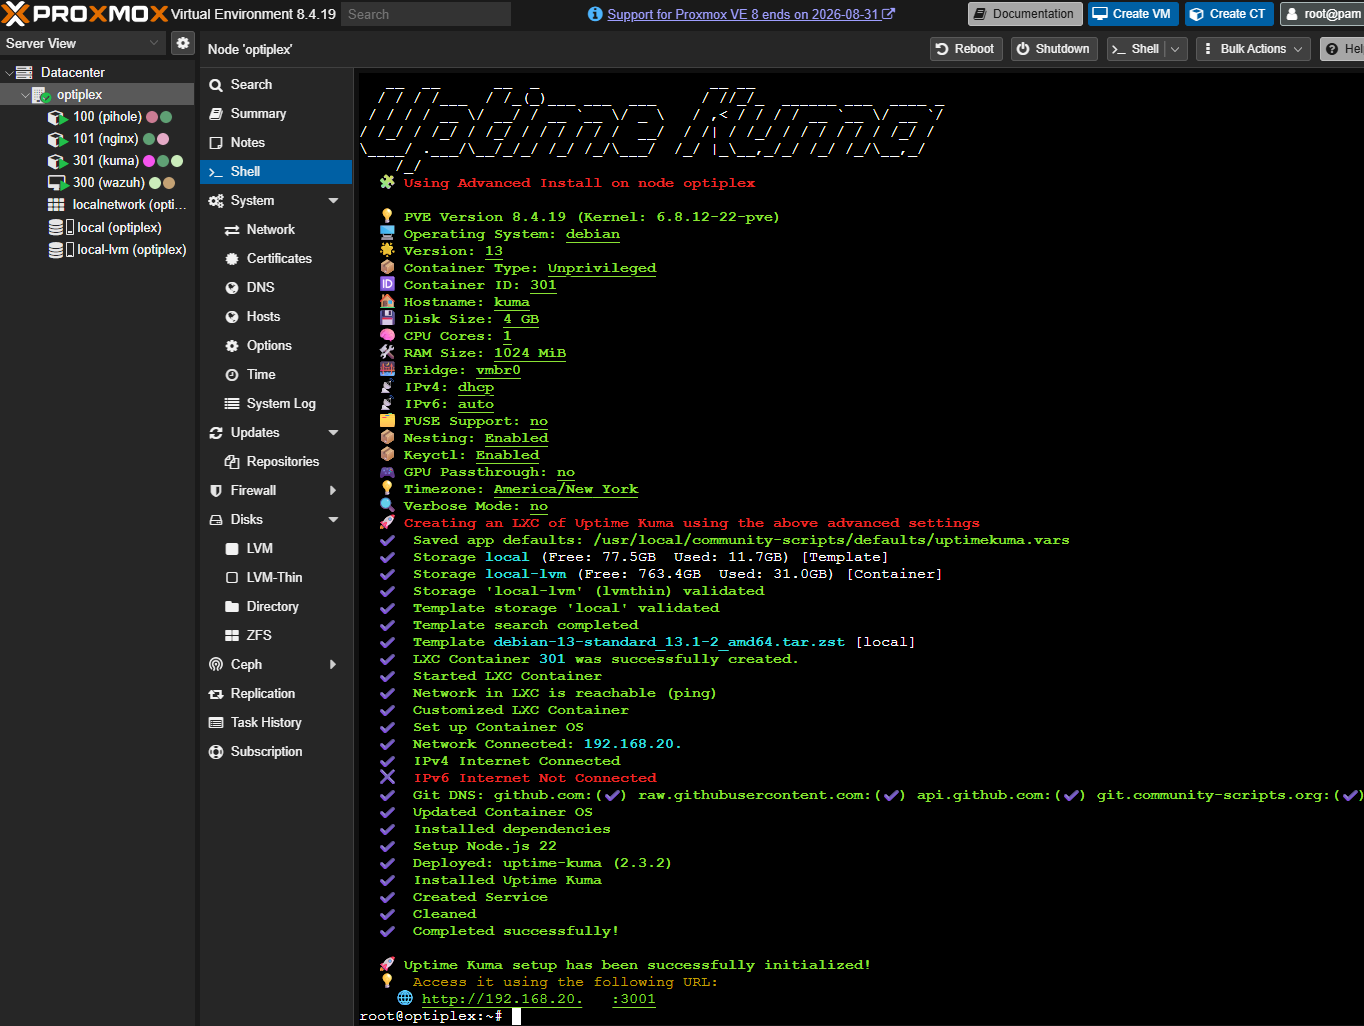 Uptime Kuma LXC container installed in Proxmox
Dashboard
Monitors are configured for all active services, accessed through their NPM-routed domains.
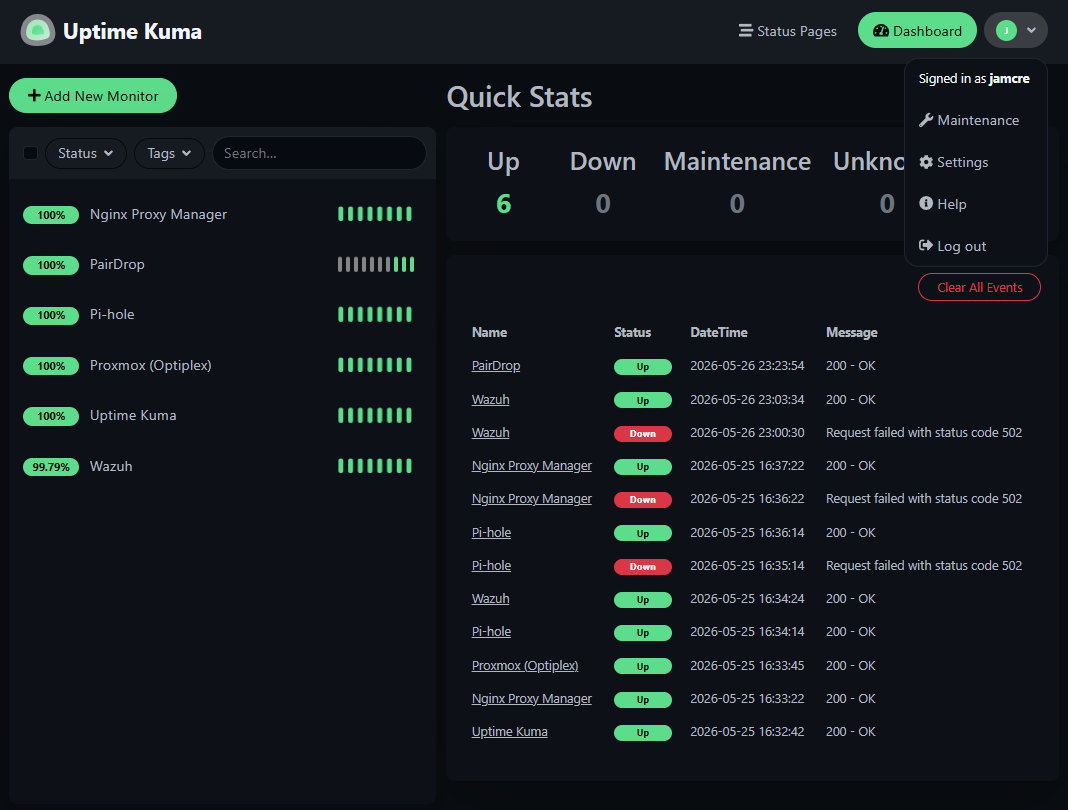 Uptime Kuma dashboard with active monitors across all lab services
The current setup uses default configuration from the helper script, no custom notification channels, status pages, or monitor intervals yet. This is a starting point; a dedicated post may cover Uptime Kuma in more detail later.
Naming Convention Updates
V3 introduced three hostname changes: two renames of existing machines and one new addition.
| Hostname | Previous Name | Machine | VLAN |
|---|---|---|---|
forge | citadel | Custom desktop (i7-10700K, 32 GB, RTX 3070, Win 11) | 10 — Trusted |
slate | annex | MacBook Pro 13-inch 2020 (macOS Sequoia) | 10 — Trusted |
midnight | — | M2 MacBook Air (macOS) | 10 — Trusted |
forge and slate are the same physical machines from V2, hostname changes only. midnight is a new node, already configured with a static DHCP lease and a Wazuh agent enrolled.
As the infrastructure has grown across three homelab generations, keeping naming conventions, hardware specs, and service assignments organized has become too extensive. Thus I will have, at a later date, documentation posts that will be living documents, updated as things change.
V3 Architecture: Current State
| Layer | Components |
|---|---|
| Hardware | optiplex (primary node), inspiron (available), forge, slate, midnight |
| Network | Three-VLAN architecture — unchanged from V2 |
| Virtualization | Proxmox VE on optiplex |
| DNS | Pi-hole — cross-VLAN resolution, local hostname records |
| SSL / Routing | Nginx Proxy Manager — wildcard certificate, HTTPS for all services |
| Security | Wazuh SIEM — agents enrolled on all active machines |
| Monitoring | Uptime Kuma — uptime checks across all NPM-routed services |
What’s Next
optiplex is live, core services are running, and the monitoring layer is in place. V3 launches with a stronger foundation than V2. More CPU threads, twice the RAM on the primary node, and service uptime visibility from day one.
The infrastructure is stable. What gets built on top of it is still taking shape.